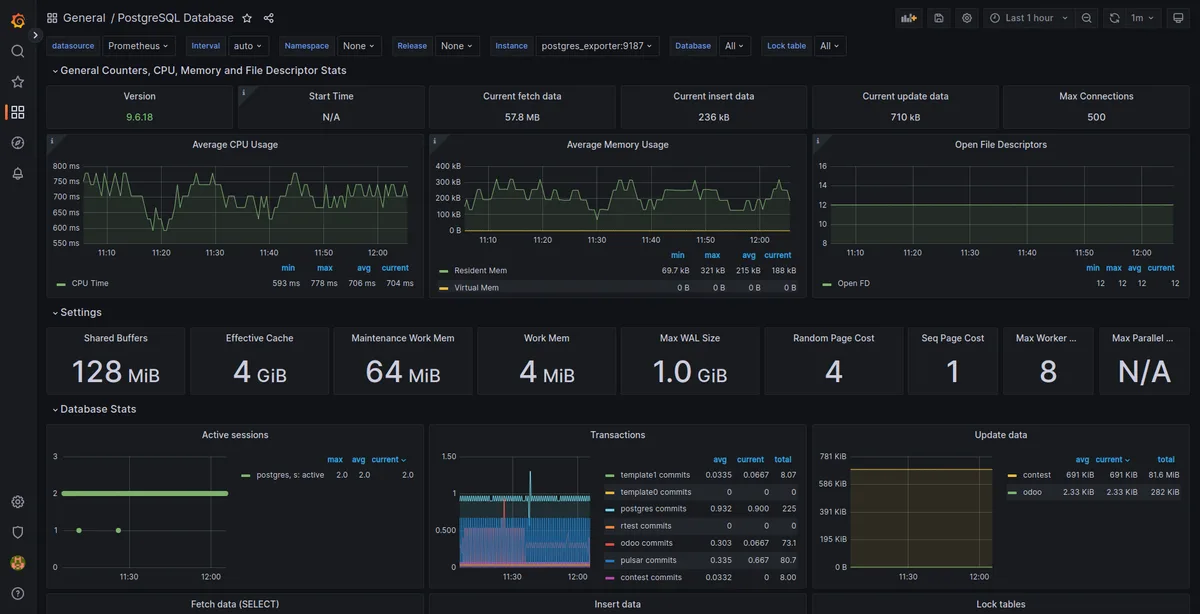
The Grafana dashboards are a really nice interactive display of metrics. What we want to do is take those graphs from a dashboard and share them on a static monthly report.
I found some advice in how to grab shared output using date epochs. This enables me to dynamically specify a URL to grab a view from. But this still requires access to the web service. As our monitoring is only available internally, and we don’t want to expose it to the customers, we need to find a way of taking snapshots of the graphs and presenting them independently of the Grafana server.
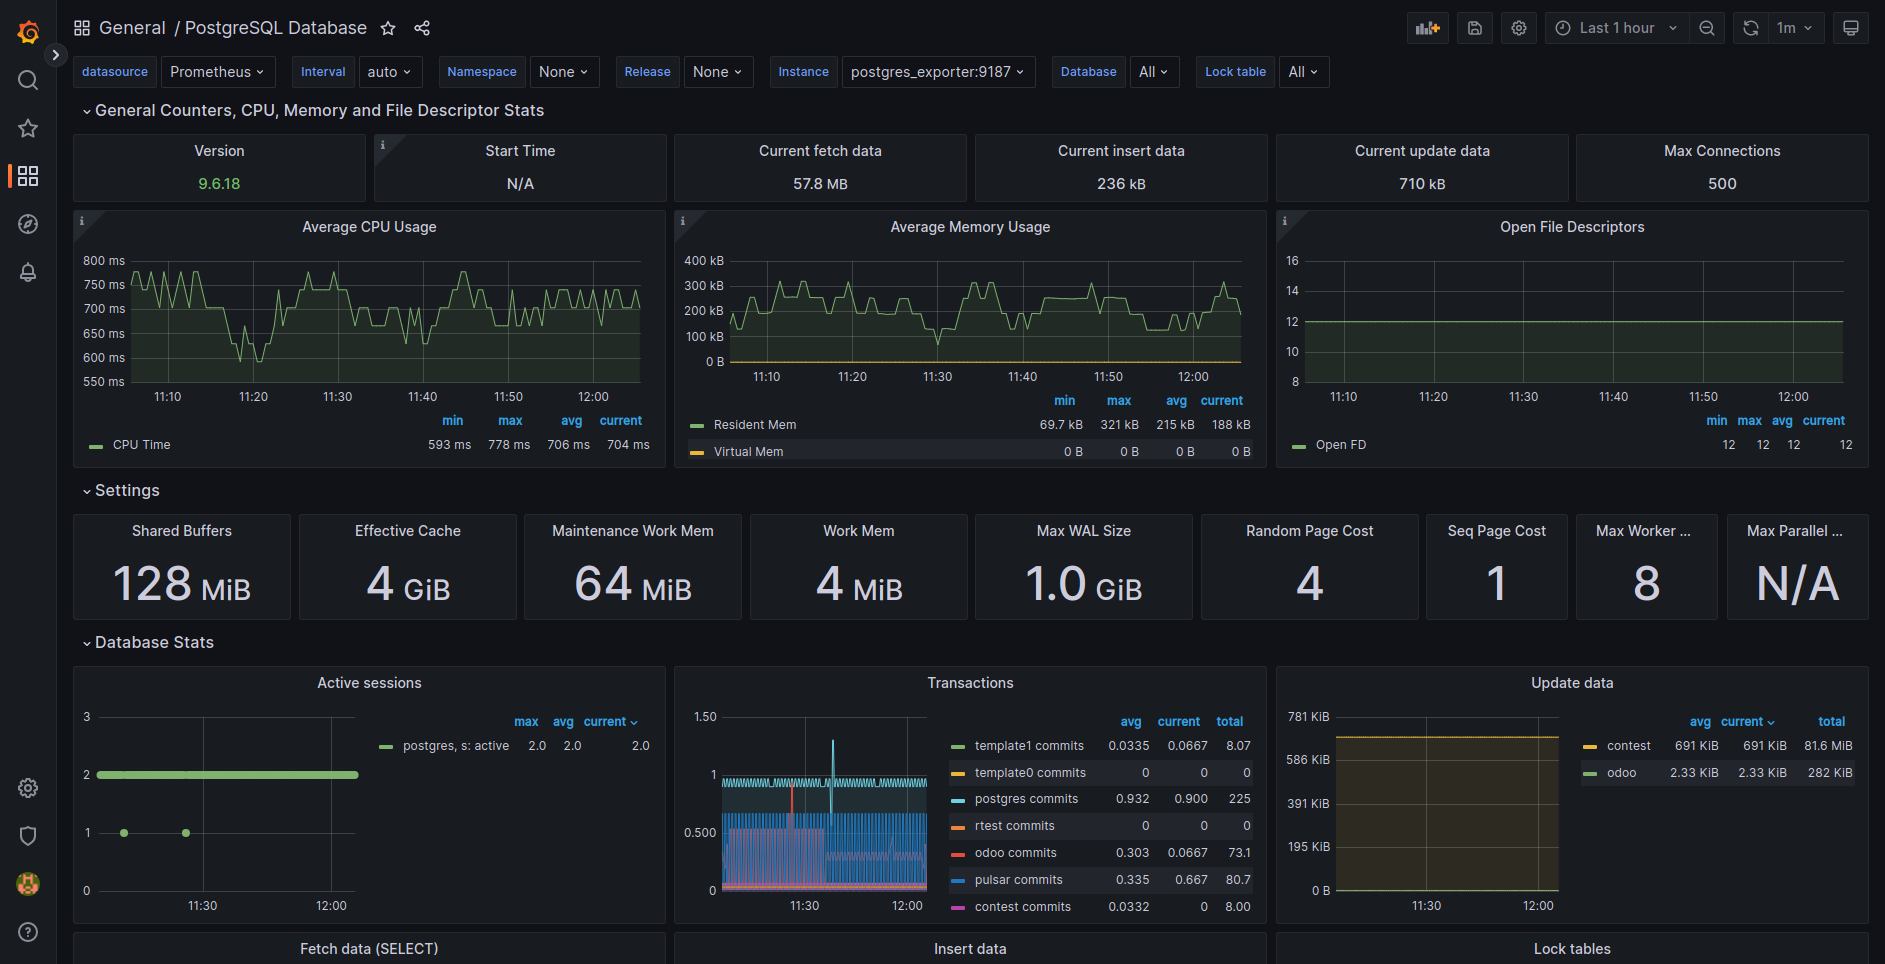
We have our PostgreSQL dashboard, but let’s say I want to grab the “Average CPU Usage” graph from it. In the human world, I just grab it with a screenshot tool. I need to automate that.
Grafana has a plugin called grafana-image-renderer. This is pretty much an instance of a Chrome browser that gets fired when you ask for a “Direct link rendered page”.
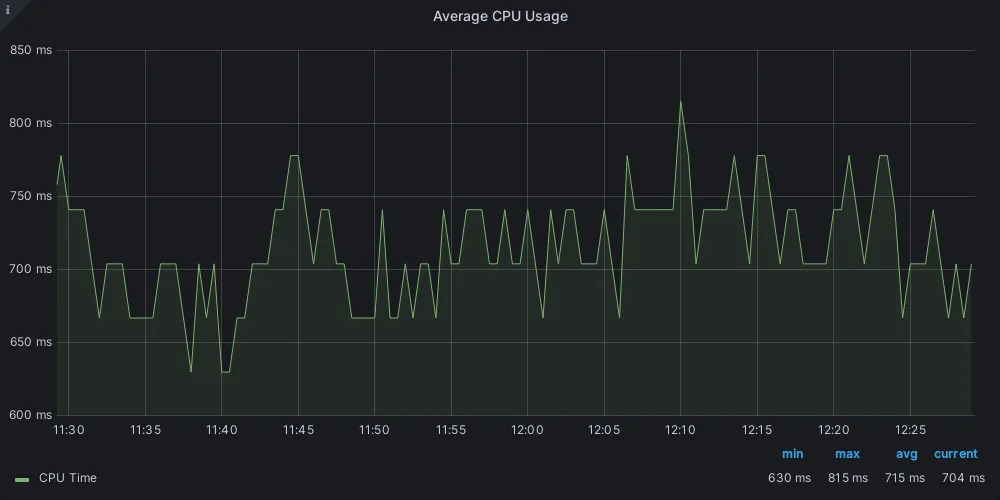
As we are using a Docker image for Grafana there were many things I had to do to make this work. There are quite a few prerequisites that meant it didn’t work until I satisfied them all. To do that, I used a custom Dockerfile.
FROM grafana/grafana-oss:main-ubuntu

USER root

RUN apt-get update && \
    apt-get install -y --no-install-recommends \
        libasound2-dev \
        libatk-bridge2.0-dev \
        libatk1.0-0 \
        libcups2-dev \
        libdrm-dev \
        libgbm-dev \
        libglib2.0-dev \
        libnss3-dev \
        libpango1.0-dev \
        libxcomposite-dev \
        libxdamage-dev \
        libxkbcommon-dev \
        libxrandr-dev && \
    rm -rf /var/lib/apt/lists/*

USER grafana
Then run this from docker compose using
version: '3.7'

services:
  grafana:
    build: build/grafana
    volumes:
      - "${PWD}/grafana/data:/var/lib/grafana:rw"
    ports:
      - 3000:3000
    restart: unless-stopped
Install the plugin into the Docker container using:
grafana-cli plugins install grafana-image-rendererAfter a restart, when you chose to share a graph you will get an option at the bottom of the share dialog - Direct link rendered image. When you click this, a new tab/window should open with only your required graph inside. It takes a second or two as in the background it’s launching Chrome to take your snapshot.
The renderer return a URL like this:
http://grafana:3000/render/d-solo/000000039/postgresql-database?orgId=1&refresh=1m&from=1676374153910&to=1676377753911&panelId=22&width=1000&height=500&tz=Europe%2FLondonFrom this you can see we can pass it out to another process for curl or pandoc to pull the image for a specific range by changing the from and to parameters to match the epochs we want our graph to contain.
API
If you are going to automate this, you’ll need to set up an API token in Grafana. Once you have the API, it even shows you an example curl command. You can then take the authorisation part and add it to any call you make to pull the image, eg.
curl -H "Authorization: Bearer SecretKey" http://grafana:3000/render/d-solo/000000039/postgresql-database?orgId=1&refresh=1m&from=1676374153910&to=1676377753911&panelId=22&width=1000&height=500&tz=Europe%2FLondon -o image.pngA Simple Scraper in python
This script grabs a panel image for panel number 87 for the dates 1st Feb 2023, to 15th Feb 2023. Modify the main function to suit your needs, I’d parameterise it to make if callable with a start date.
The endpoint is the URL to your Grafana instance and the shared render’ The token is the API key you got from Grafana. The params contain the query string data used to get the image. This is where to, from and the panel ID are passed to give us the desired output.
NOTE: If you try to call too far ahead, the graph returned shows no data. So I included a check for that and changed the to date to now, if it is greater.
import requests
import datetime

token = "SecretKey"
endpoint = "http://localhost:3000/render/d-solo/yTRPSHJ4k/overview"

def epoch(dt):
    return (dt - datetime.datetime(1970,1,1,0,0)).total_seconds() * 1000

def scrape_image(date_from, date_to, panel_id):
    if date_to > datetime.datetime.now():
        date_to = datetime.datetime.now()

    params = {
        "orgId": "1",
        "var-host": "All",
        "theme": "light",
        "refresh": "1m",
        "from": "%.0f" % epoch(date_from),
        "to": "%.0f" % epoch(date_to),
        "panelId": panel_id,
        "width": "1000",
        "height": "500",
        "tz": "Europe/London"
    }

    print(params)

    headers = { "Authorization": "Bearer %s" % (token) }

    r = requests.get(endpoint, headers=headers, params=params)

    open("image_%s_%d.png" % (date_from.strftime("%Y%m%d"), panel_id), 'wb').write(r.content)


if __name__ == "__main__":
    scrape_image(date_from=datetime.datetime(2023,2,1,0,0), date_to=datetime.datetime(2023,2,15,0,0), panel_id=87)
Pandoc
Using Pandoc I was able to create a Markdown document with the URL of the direct rendered image and then pass Pandoc the authorisation header to make it work. The url in the Markdown has the to, from and panel ID parameters I can change to get the results as I want them.
input.md
# Testing Grafana and PANDOC

End of testThen call Pandoc to render my Markdown into a PDF.
$ pandoc --request-header Authorization:'Bearer SecretKey' input.md -f markdown -t pdf -s -o output.pdfReferences
https://grafana.com/grafana/plugins/grafana-image-renderer/?tab=installation
https://lovethepenguin.com/grafana-how-to-export-graphs-as-images-and-email-them-4ef90689a5fa
https://github.com/prometheus-community/postgres_exporter
https://grafana.com/grafana/dashboards/9628-postgresql-database/