
With the temperature the past few weeks I thought I’d setup a means of monitoring it to trigger alerts in Grafana or Incinga2 by using a Raspberry Pi to collect the data.
There are projects for this all over the place so I thought I’d take one and expand upon it - https://pimylifeup.com/raspberry-pi-humidity-sensor-dht22/.
The original work records data to a CSV file which we can’t use for Grafana. We need something a little more enterprise, like MySQL or PostgreSQL. Which is a shame because for this sqlite would probably have been good enough.
I bought a DHT22 sensor from eBay and the one I chose was pre-wired to include the resistor. This meant all I had to do was plug it onto the RPi board for pin 1 to +. pin 6 to - and pin 7 to out.
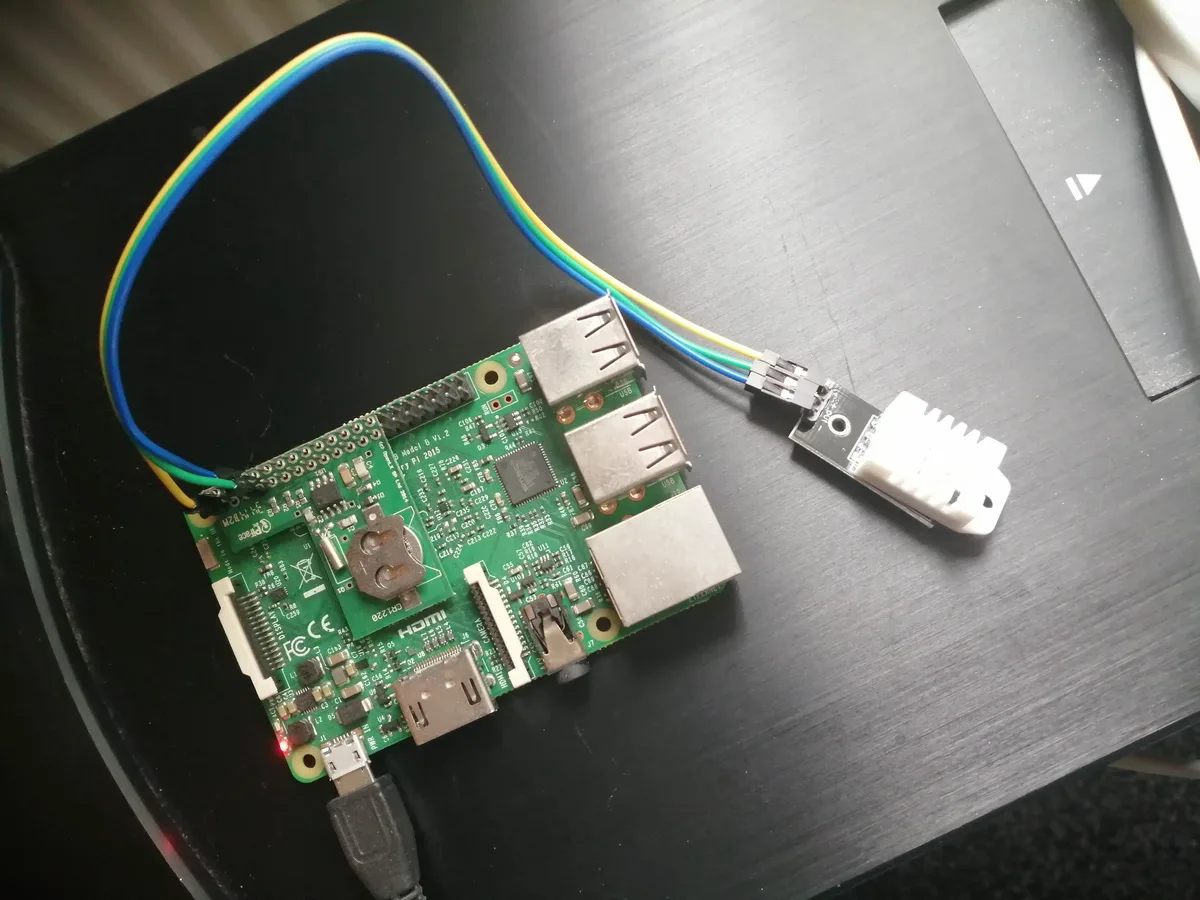
RPi with DHT22 Connected
Grafana won’t run on the older Pi’s and needs at least a RPi 2 B+ and in this instance I wanted to use the Pi for everything. But I could just as easily setup a PostgreSQL and Grafana instance on something else and have the Raspberry Pi report it’s data to that. Then I could use a lesser Pi like a Zero and point the python script at a remote server.
Here’s the python script I used to record the environmental settings every 5 minutes into my PostgreSQL database called ‘grafana’.
#!/usr/bin/env python3

import os
import time
import psycopg2
import Adafruit_DHT

DHT_SENSOR = Adafruit_DHT.DHT22
DHT_PIN = 4
METRIC = 'dht1' # The name of this sensor

cn = psycopg2.connect(
  host="localhost",
  database="MyDatabase",
  user="pi",
  password="SecretKey"
)
cur = cn.cursor()

# Create the table if it doesn't exist
sql = """create table if not exists environment (
  id serial primary key not null,
  date timestamp,
  temperature numeric,
  humidity numeric
  );"""
cur.execute(sql)

lastHumidity, lastTemperature = Adafruit_DHT.read_retry(DHT_SENSOR, DHT_PIN)

while True:
  humidity, temperature = Adafruit_DHT.read_retry(DHT_SENSOR, DHT_PIN)

  if humidity is not None and temperature is not None:
    # Ignore fluctuations of more than 30%
    if (abs(humidity - lastHumidity) / lastHumidity) < .3 and (abs(temperature - lastTemperature) / lastTemperature) < .3:

      sql = """insert into environment (date, temperature, humidity, metric) values (%s, %s, %s, %s);"""

      cur.execute(sql, (time.strftime('%d/%m/%y %H:%M'), temperature, humidity, METRIC))
      cn.commit()
      lastHumidity = humidity
      lastTemperature = temperature

  else:
      print("Failed to retrieve data from humidity sensor")

  time.sleep(300) # Every 5 mins

cur.close()
cn.close()
Initially when I ran the script I noticed that every so often I’d get a spurious reading of a humidity of 3300 or the like. To defend against this I added in a check to see if the reading was more than 30% different to the ‘last’ reading I’d ignore it.
To use the script change the psycopg2.connect() values to reflect your server and database name/credentials. This could be on the same RPi or remotely.
Create an empty database on the PostgreSQL server and the script will create a table in it for you.
$ sudo -u postgres psql
=# create database MyDatabase with owner=pi;
\q
Grant access to the database to the Grafana user.
$ sudo -u postgres psql
grant select on environment to grafana;
Then I can add my PostgreSQL database to Grafana as a data source, point my panels at the environment table and have some nice graphs showing the temperature and environment.
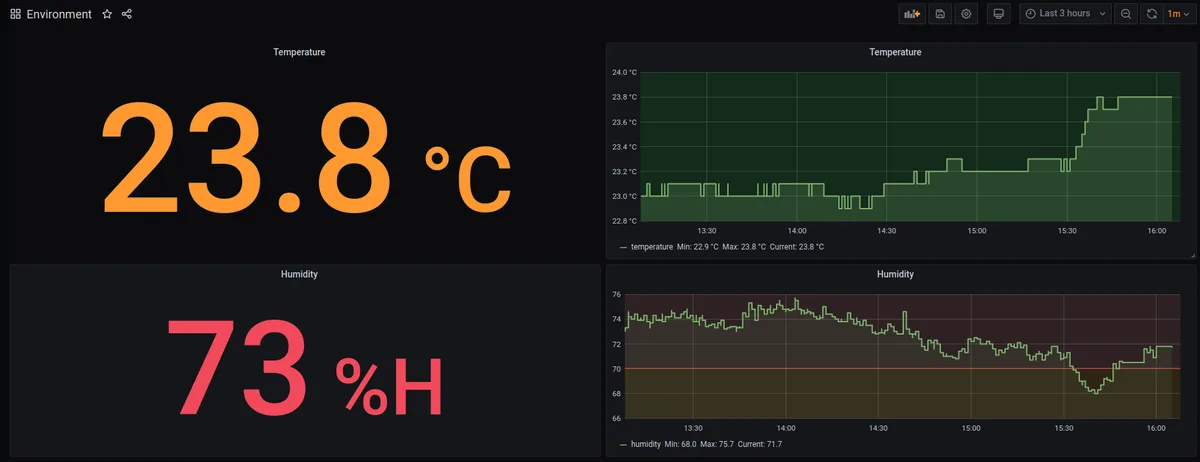
Grafana Panels