
With glances on Linux we are able to get a good overview of performance, including the dockers that are running. Rather than simply watch this on screen we can port the data into an InfluxDB (time-series database) and produce nice graphs from current and historic data.
InfluxDB
First setup an InfluxDB service - this is fairly trivial and can be achieved in minutes using a docker-compose to bring it online.
version: '3.2'

services:
  influxdb:
    image: ${INFLUXB_IMAGE:-influxdb}:${INFLUXB_IMAGE_VERSION:-latest}
    environment:
      INFLUXDB_DB: ${INFLUXDB_DB:-influxdb}
      INFLUXDB_ADMIN_USER: ${INFLUXDB_ADMIN_USER:-admin}
      INFLUXDB_ADMIN_PASSWORD: ${INFLUXDB_ADMIN_PASSWORD?REQUIRED}
      INFLUXDB_USER: ${INFLUXDB_USER:-influx}
      INFLUXDB_USER_PASSWORD: ${INFLUXDB_USER_PASSWORD?REQUIRED}
      INFLUXDB_WRITE_USER: ${INFLUXDB_WRITE_USER:-writer}
      INFLUXDB_WRITE_USER_PASSWORD: ${INFLUXDB_WRITE_USER_PASSWORD?REQUIRED}
    volumes:
      - "${CONTAINER_VOLUMES?REQUIRED}/influxdb:/var/lib/influxdb"
    ports:
      - "8086:8086"
Then the .env file entries look like:
CONTAINER_VOLUMES=/srv/container-volumes

INFLUXDB_ADMIN_PASSWORD=SuperSecretKey
INFLUXDB_USER_PASSWORD=SecretKey
INFLUXDB_WRITE_USER_PASSWORD=writer
In this example we’re going to use a user called writer to put data into the database. It doesn’t need any other privileges.
Create the database and set a retention policy on it that keeps current data only for two hours and then the average values for a 30 minute resolution for one year (53 weeks). The easiest way to do this is by creating a text file containing the SQL.
glances.sql
create database glances;
create database glances;
create retention policy "two_hours" on "glances" duration 2h replication 1 default;
create retention policy "one_year" on "glances" duration 53w replication 1;
create continuous query "cq_30m" on "glances" begin
select mean(*) into glances.one_year.:MEASUREMENT from /.*/ group by time(30m)
end;
Then run the SQL file into the docker container using:
cat glances.sql | docker exec -i grafana_influxdb_1 influxGlances
Next install glances onto the source of the performance data, it’s generally available from the apt repo so an apt install glances should do it. Point it to our new InfluxDB instance by editing the /etc/glances/glances.conf file and updating the [influxdb] entries.
[influxdb]
# Configuration for the --export influxdb option
host=MyInfluxDBServer
port=8086
protocol=http
user=writer
password=writer
db=glances
prefix=`hostname`
Make the changes as required for your environment. In production we’d obviously want this behind https, not http.
Edit the glances service file /lib/systemd/system/glances.service
[Unit]
Description=Glances
Documentation=man:glances(1)
Documentation=https://github.com/nicolargo/glances
After=network.target

[Service]
ExecStart=/usr/bin/glances --export influxdb --quiet
Restart=on-abort

[Install]
WantedBy=multi-user.target
Don’t forget to use systemctl daemon-reload and then restart the service.
What we should have now is a system that is reporting back into our time-series InfluxDB and we have a high resolution 2 hours worth of data and a lower resolution history of data that is building up for one year.
Grafana
Our next task is to display that data graphically using Grafana.
We can easily add this into the docker-compose.yml file:
  grafana:
    image: ${GRAFANA_IMAGE:-grafana/grafana}:${GRAFANA_IMAGE_VERSION:-latest}
    ports:
      - "3000:3000"
    depends_on:
      - influxdb
Create a data source called ‘glances’ it is case sensitive. Configuration, data sources, add and select InfluxDB. Point it at your InfluxDB instance you used above - with the non-admin credentials.
There is a prebuilt dashboard for Glances available here: https://grafana.com/grafana/dashboards/2387 The only problem I found with this is that it only monitors localhost. So if you’re planning on sending data from other sources it needs to be modified.
This is a modified version that will handle different hosts.
glances.json
Snippet from Gitlab https://gitlab.com/-/snippets/2010913
Download and save the file then in Grafana go to Manage dashboards, import and choose to upload this json file.
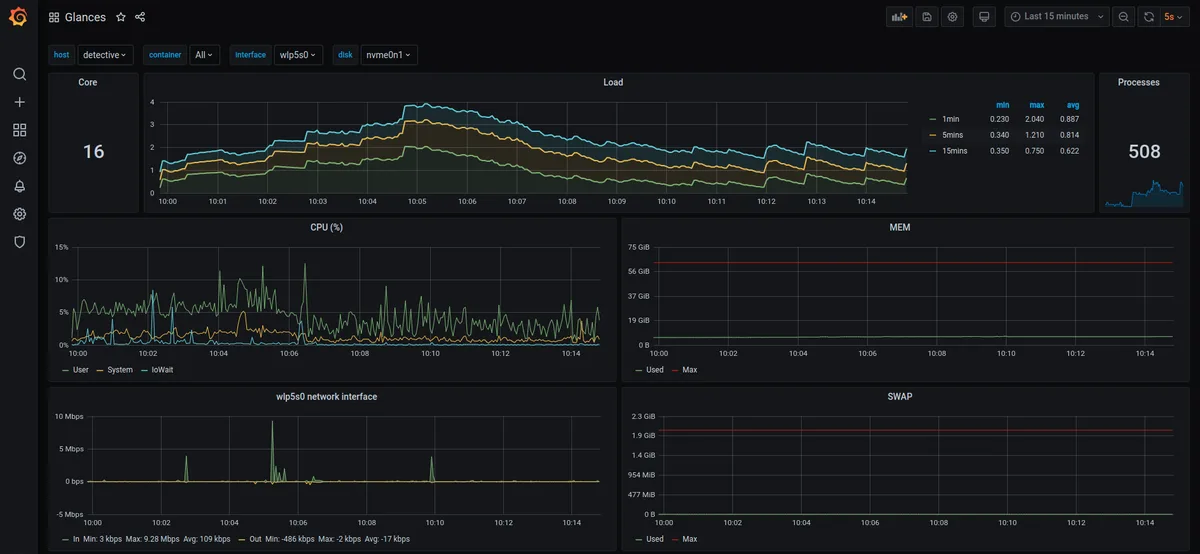
Glances Dashboard
Finally we need to display the lower resolution annual data. I put together a dashboard for this too.
annual.json
Snippet from Gitlab https://gitlab.com/-/snippets/2010961
References
Downsampling Data https://docs.influxdata.com/influxdb/v1.8/guides/downsample_and_retain/